
The client expressed the need for a simulation model to address the following research problem: in what circumstances does a destination dispatch (DD) elevator system transport patrons more efficiently than a traditional "Highest Unanswered Floor First" (HUFF) elevator set-up?
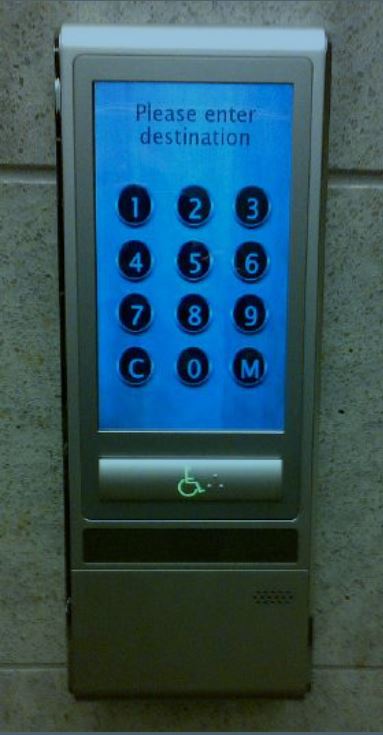
In a destination dispatch system, the destination buttons are moved from within the elevator cars to the waiting area, making buttons absent inside the cars. In this set-up, information on a patron’s intended destination is available to the system as soon as they register on a panel on each floor (left). DD has the advantage of knowing each patron’s intended route so that cars can effectively prioritize pickup and drop-off routes according to demand. Additionally, since each DD elevator only takes a single destination at a time, there are less stops en route. However, it is unclear in what scenarios a destination dispatch system is advantageous over the traditional HUFF algorithm. In specific, the problem to be solved was to determine for what set of building parameters values (characterized by number of floors and patrons per floor) destination dispatch is to be recommended over traditional HUFF, given a typical office building arrival process. DD is recommended for some set of building dimensions if less elevator cars are required for the system performance to satisfy some criteria in simulation. In addition, this simulation tool would be general enough to adapt to any building parameters.
We developed fully functional simulation models of a destination dispatch elevator system and a HUFF elevator system, both with variable number of floors, variable number of elevator cars, and variable building population. For any particular set of building parameters, the efficiency of each elevator configuration was measured by the minimum number of cars need to achieve some performance measure. The two performance measures investigated were:
1. Achieve < 50s passenger waiting time to enter the elevator with a 95% probability.
2. Achieve a journey time of less than some threshold, which scales by number of floors, at 95% probability.
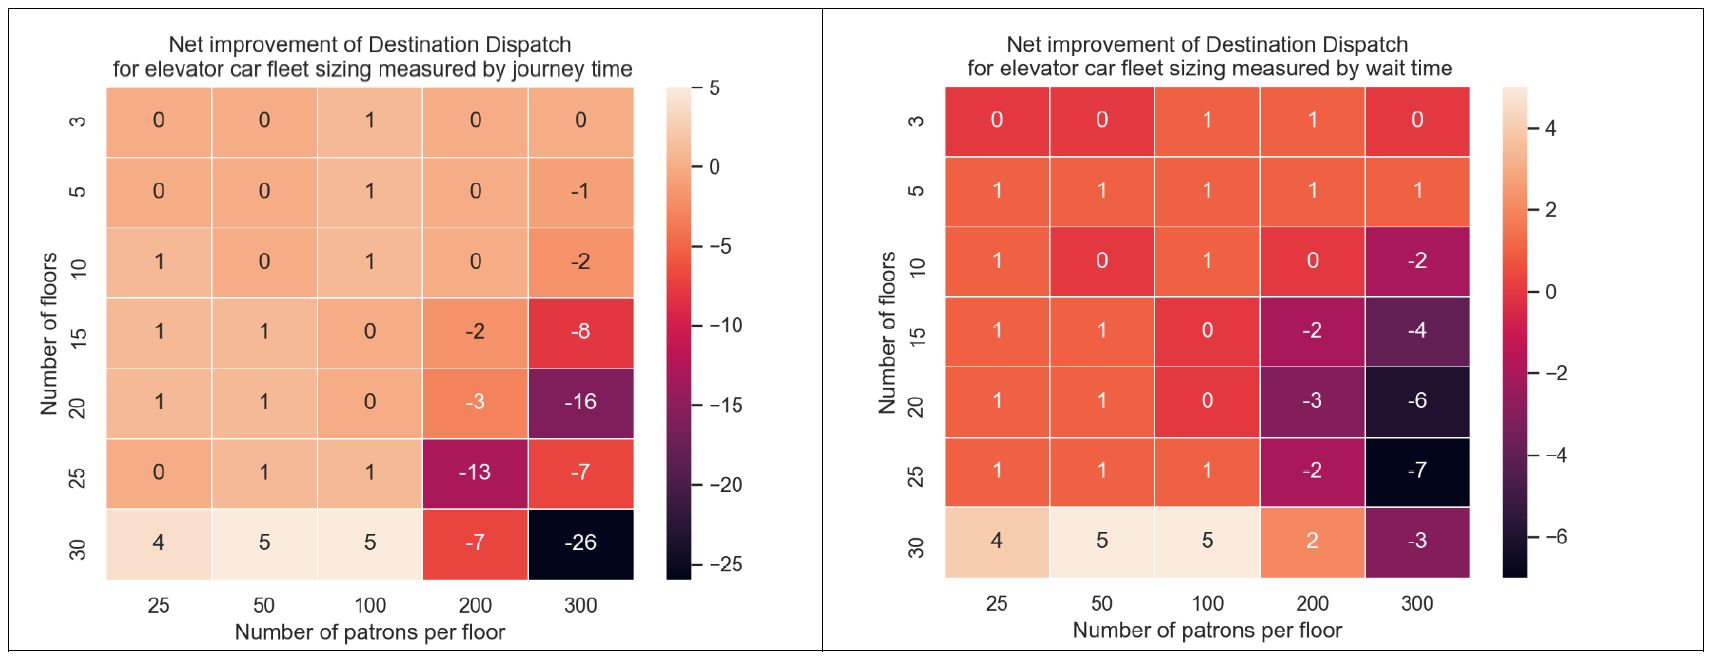
The result shown in the figure above shows the delta in elevator cars required for destination dispatch over HUFF for various building parameters. The more negative the number the more advantageous destination dispatch is. We showed that whether evaluating by journey time or wait time, buildings with a large number of floors (10+) and a large occupancy per floor (150-200+) lend well to the implementation of a destination dispatch system. However, using wait time as a performance measure tends to be more forgiving to the HUFF algorithm since destination dispatch trades off low wait time for a more significantly lower travel time.
Another take-away was that periods of time with high upwards traffic from a single floor (i.e. 8-9 AM (right)) show even greater marginal performance increase in DD since DD cars only take destinations one a time while a single HUFF car can have requests to all floors.
High down-peak traffic (5-6PM) show similar queue sizes between DD (right, top) and HUFF (right, bottom) while in high up-peak traffic (8-9AM) there is a 6-fold decrease in max queue size for destination dispatch.
The key conclusion was that building structures with a high occupancy per floor (200+), moderate to high floor count (10+), and high upwards traffic are especially well suited for destination dispatch. Luxury cruise ships, for example, fulfill all conditions.
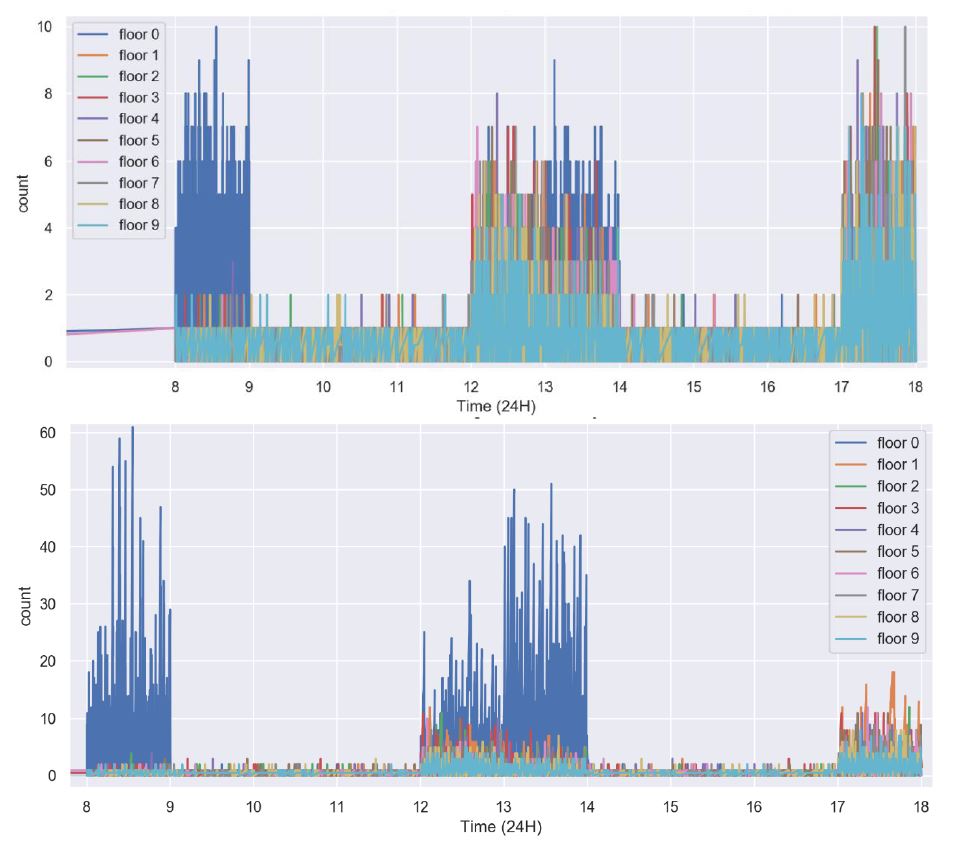
Queue sizes by floor over a single work day. DD (top), HUFF (bottom).
10 floors, 300 occupancy per floor, 12 cars for both.
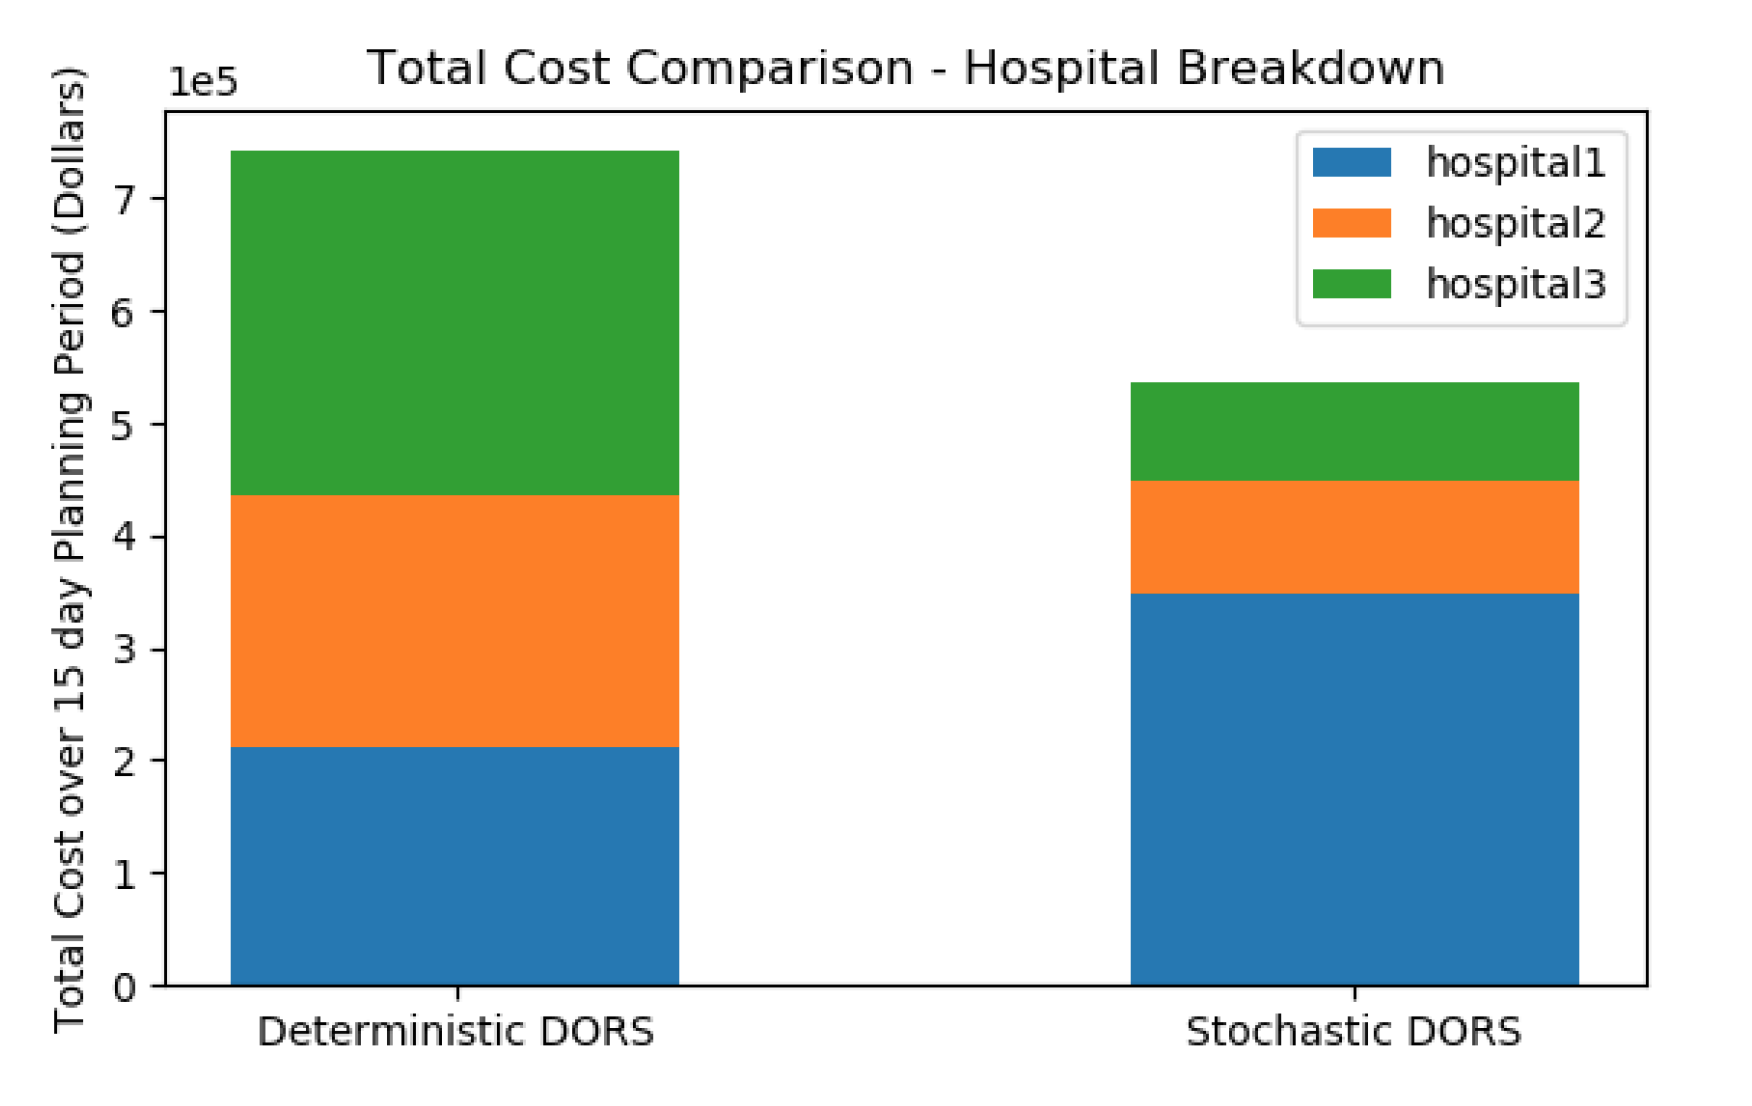
The client investigates novel approaches to scheduling resources to large-scale operating room systems. One particular innovation of theirs is a scheduling optimization algorithm known as Distributed Operating Room Scheduling (DORS), which leverages the collective resources of a collaborating group of hospitals as opposed to individual hospitals. A recent advancement made was a reformulation of the algorithm (called SDORS for stochastic DORS) to account for uncertain surgical durations. By accounting for uncertain surgical durations, the hypothesis was that this would lower costs through decreased cancellations and increased OR utilization. The objective of this project was to leverage our simulation modeling and experimentation capabilities to evaluate this novel scheduling algorithm.
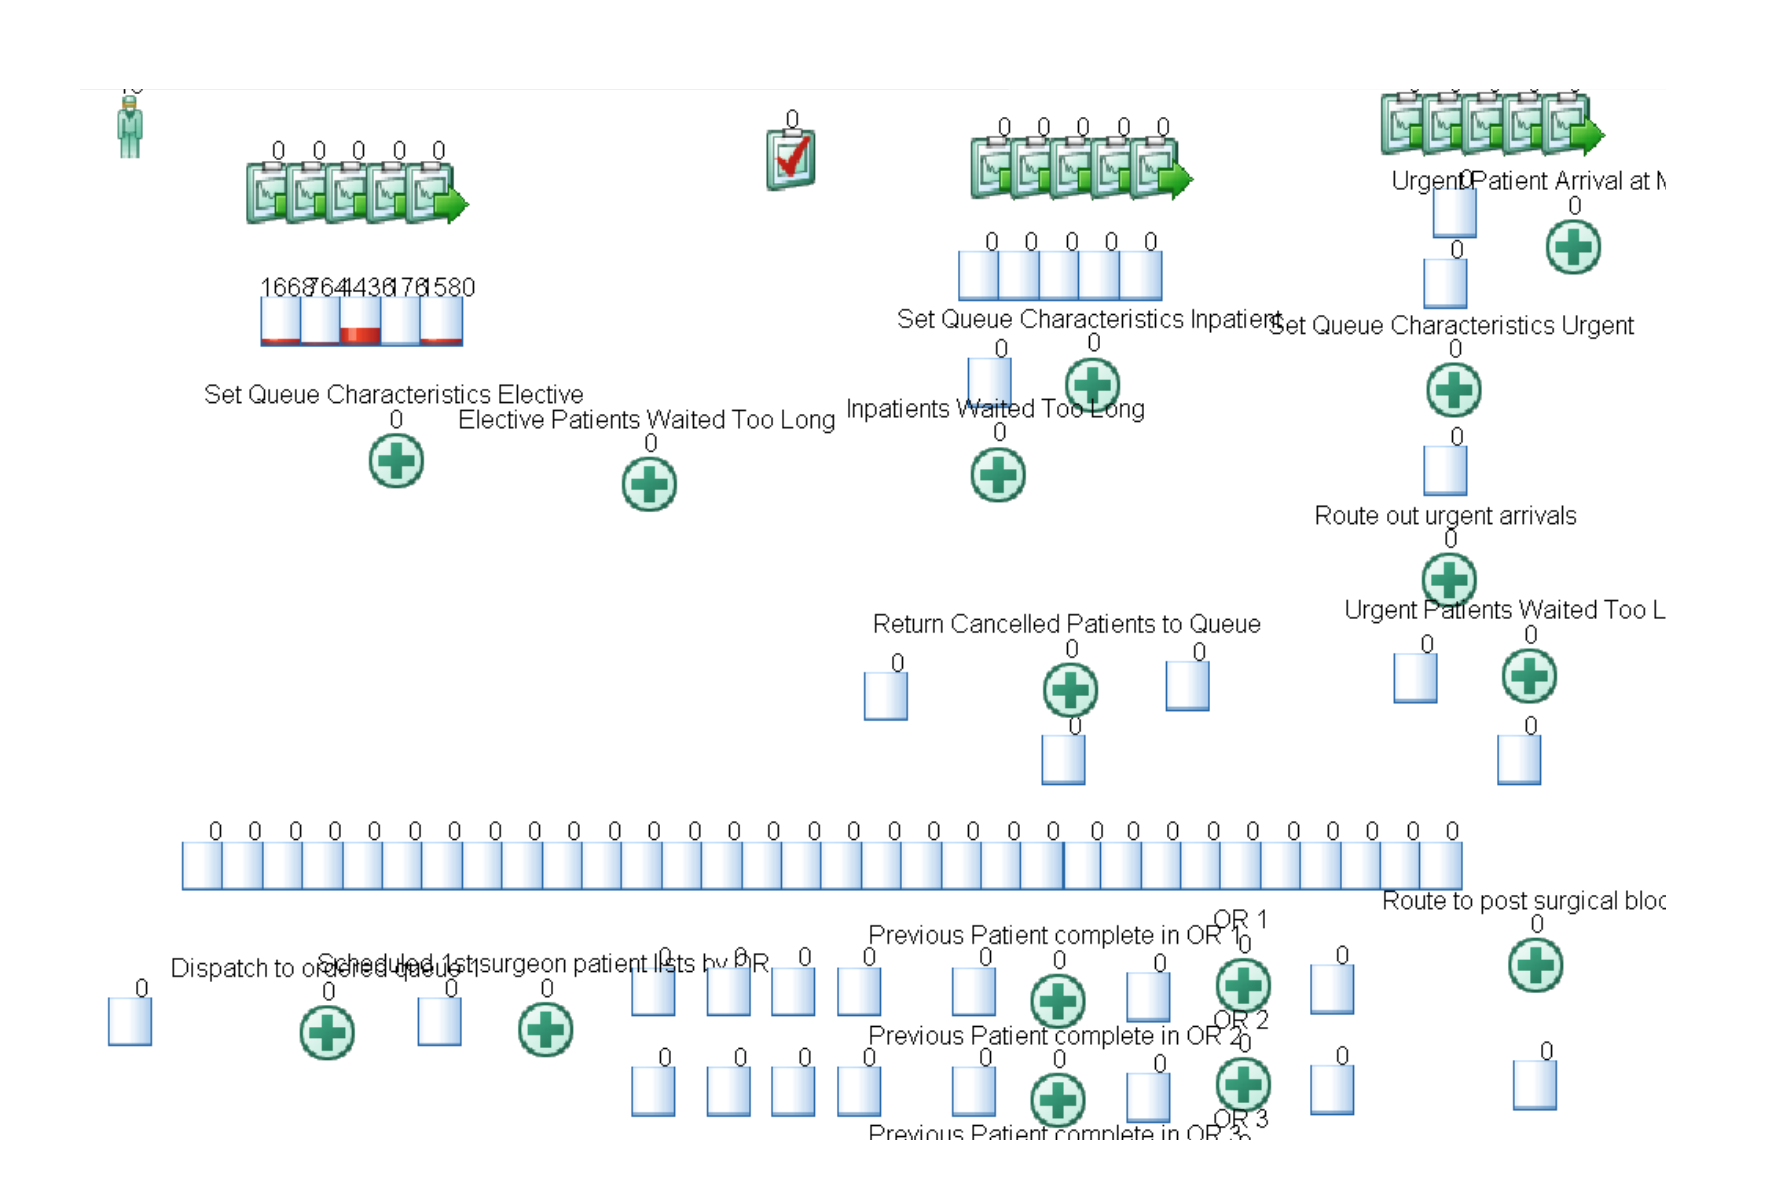
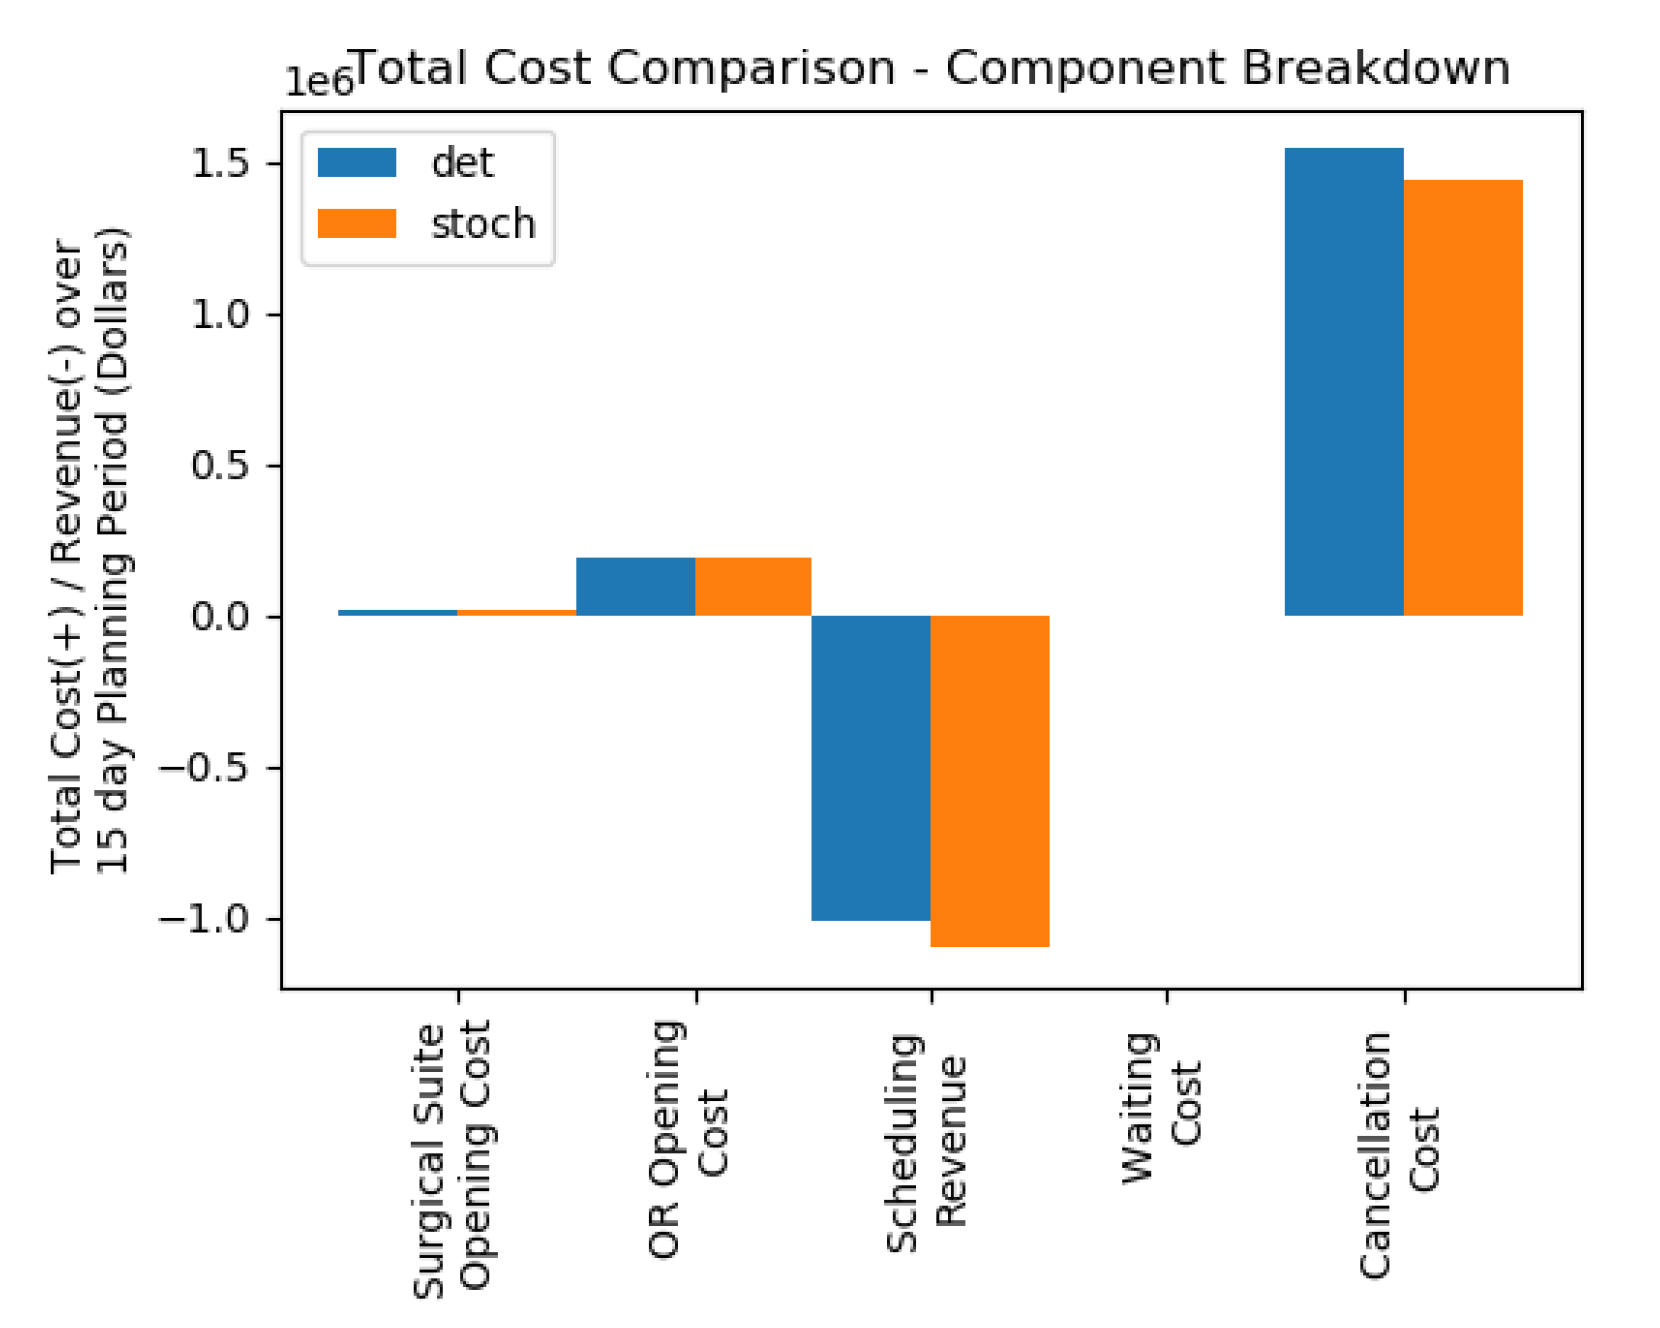
We developed a simulation model for a collaborating group of hospital suites (modelled after the University Health Network in Toronto) which provided a validated environment to explore this alternative scheduling algorithm. The DORS and SDORS scheduling optimization problems were then solved algorithmically in order to determine optimal operating room and hospital opening schedules in order to minimize cost. The resultant schedules were programmed into our simulation model which then can be evaluated against each other orders of magnitude faster than in real-time (28 weeks of hospital/OR openings in a matter of seconds). Through our simulation experiments, we found that SDORS offered a dramatic 28% decrease in operating room/ hospital costs in addition to an 8% decrease in patient cancellations.
The client architects conceptual solutions integrating their self-driving-vehicle (SDV) product as material transport automation into their customer facilities. One of the most critical decisions to be made is to determine an appropriate number of SDVs to deploy. The client’s traditional approach was to perform static, Excel-based calculations in order to size a fleet of SDVs such that the throughput of the fleet does not bottleneck the demands of the process it is being integrated into. However, there are significant limitations to this approach. Firstly, shared resources such as a limited number of payload transfer spots cannot be modeled in Excel. Additionally, this static calculation approach cannot account for random, non-deterministic elements in the system such as spikes in demand (i.e. a surge of incoming packages to be sorted).
For this project, we delivered a simulation-based approach to determining an optimal SDV fleet size for the client to deploy to their customer’s site. This particular facility features 29 injection moulding machines, each producing plastic packaging parts at some rate. These parts need to be delivered by the SDVs to a central unloading point of three conveyor spurs. A simulation-based approach is absolutely required over static calculations in this scenario for two reasons:
1. The shared resource of three conveyor unloading spurs needs to be modeled and does limit the maximum throughput of the system.
2. Each injection moulding machine has a buffer holding capacity of 3 parts, which means a fleet size needs to be determined such that the pick-up queue at each injection moulding machine is no more than 3 at any given time.
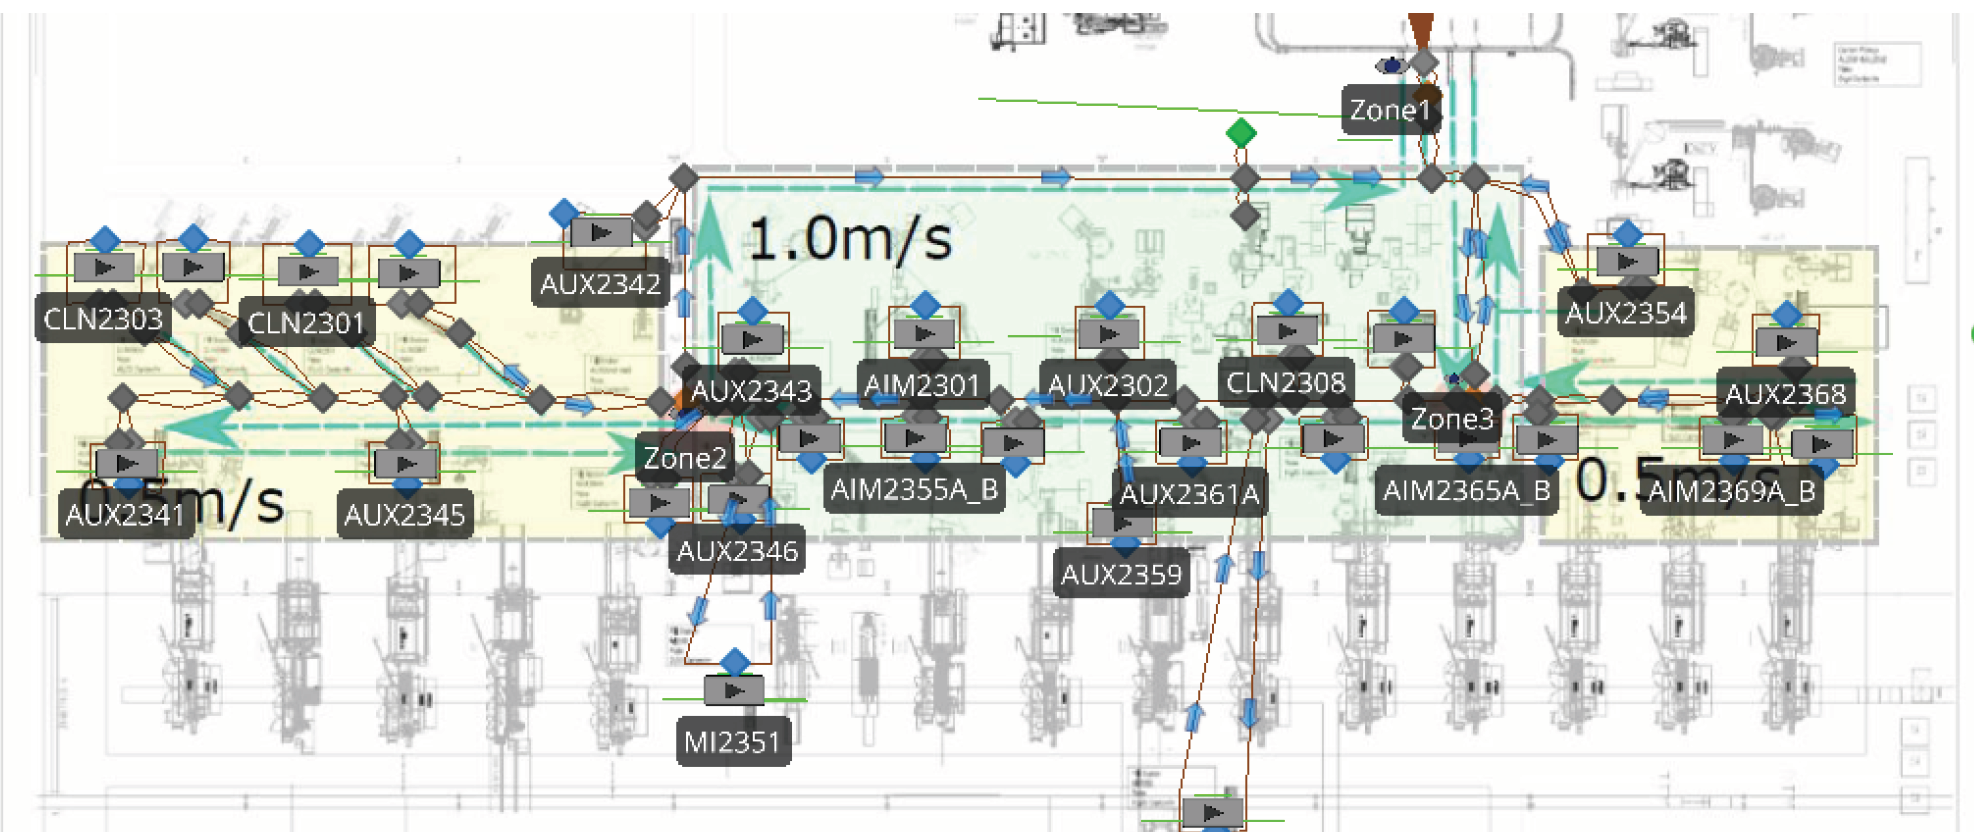
We built a simulation model of the plastic part manufacturing facility with the client’s SDV integration, which allowed us to both monitor the machine pick-up queue sizes and constrain the number of SDVs allowed to unload at the conveyor transfer point at any given time. The experimental methodology to determine a suitable fleet size is as follows: We run the simulation for a range of fleet sizes (and also charger count) and for each configuration, a metric such as maximum queue size at machines or total system throughput (i.e. # of parts unloaded by SDVs per minute) is tracked. The fleet size to deploy is determined as the minimum number of SDVs and chargers needed in order to optimize for this metric. We determined that the SDV fleet size to be deployed should be 11 vehicles with 2 chargers, as demonstrated by the figure below (left).
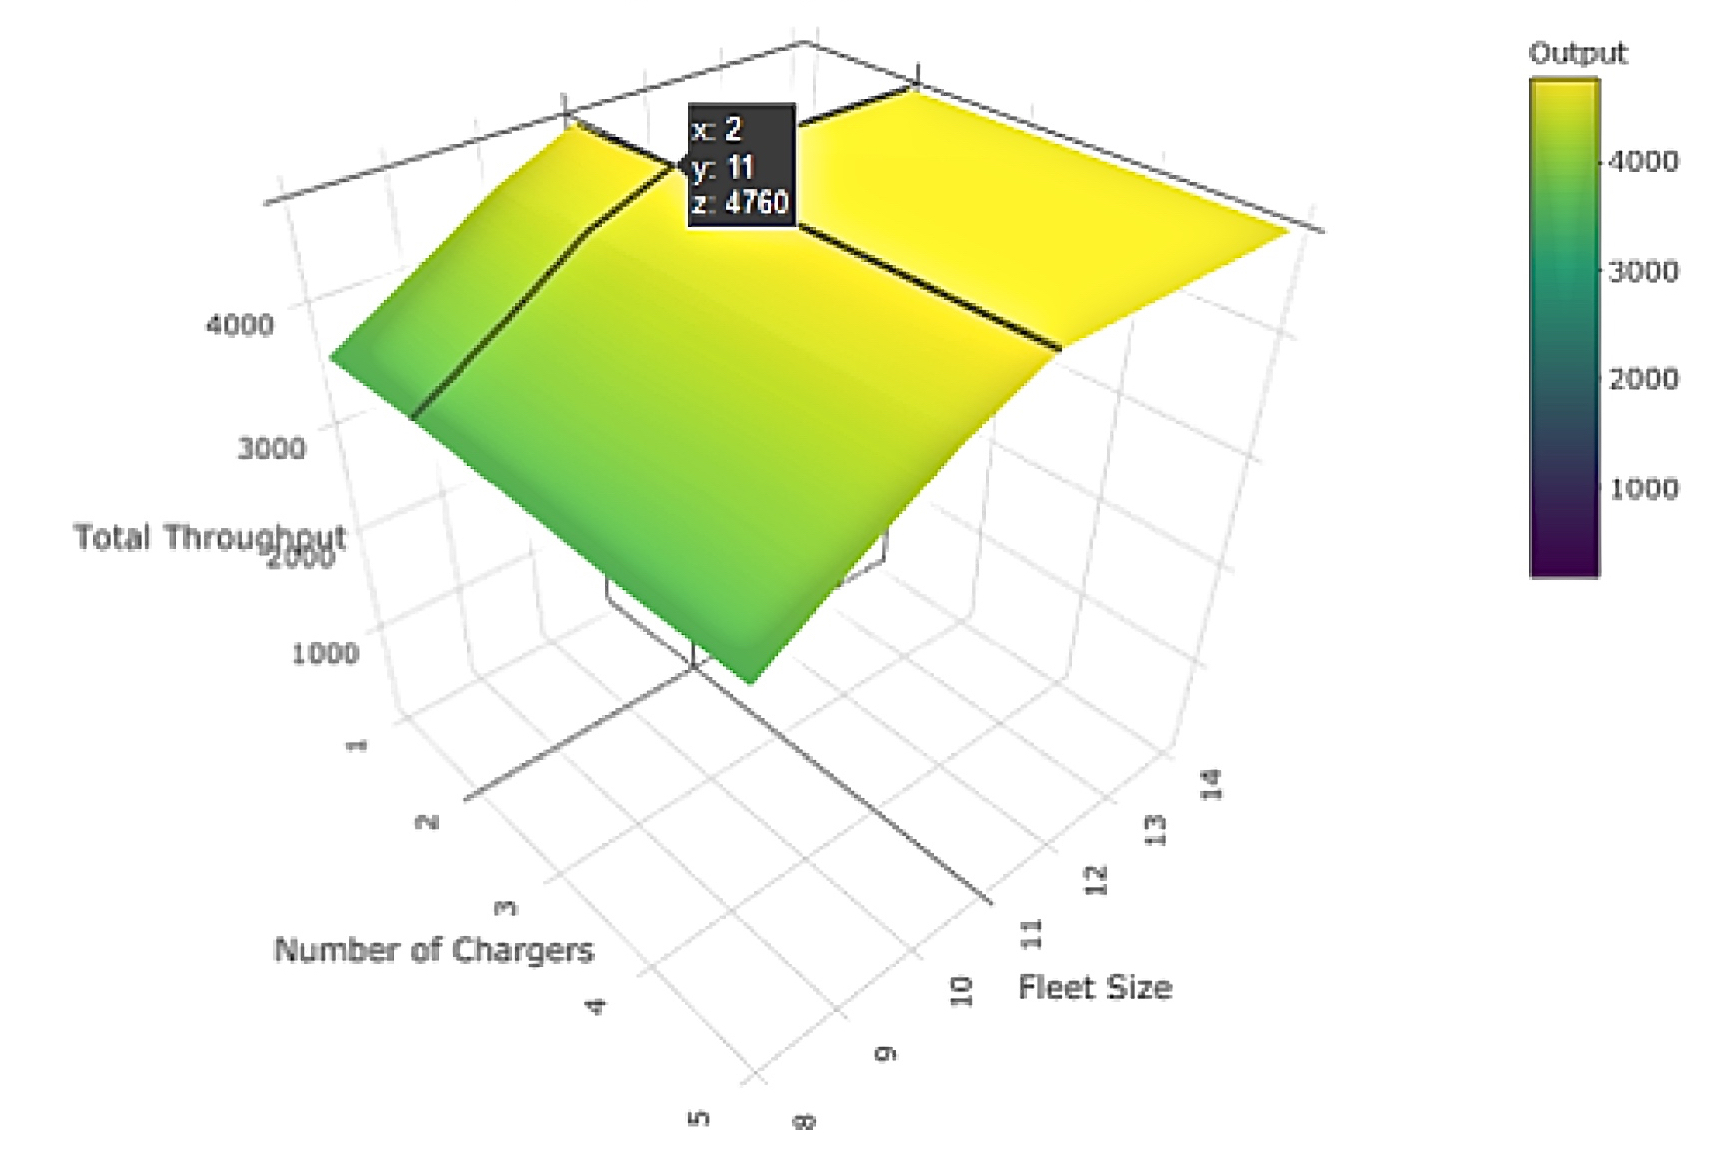
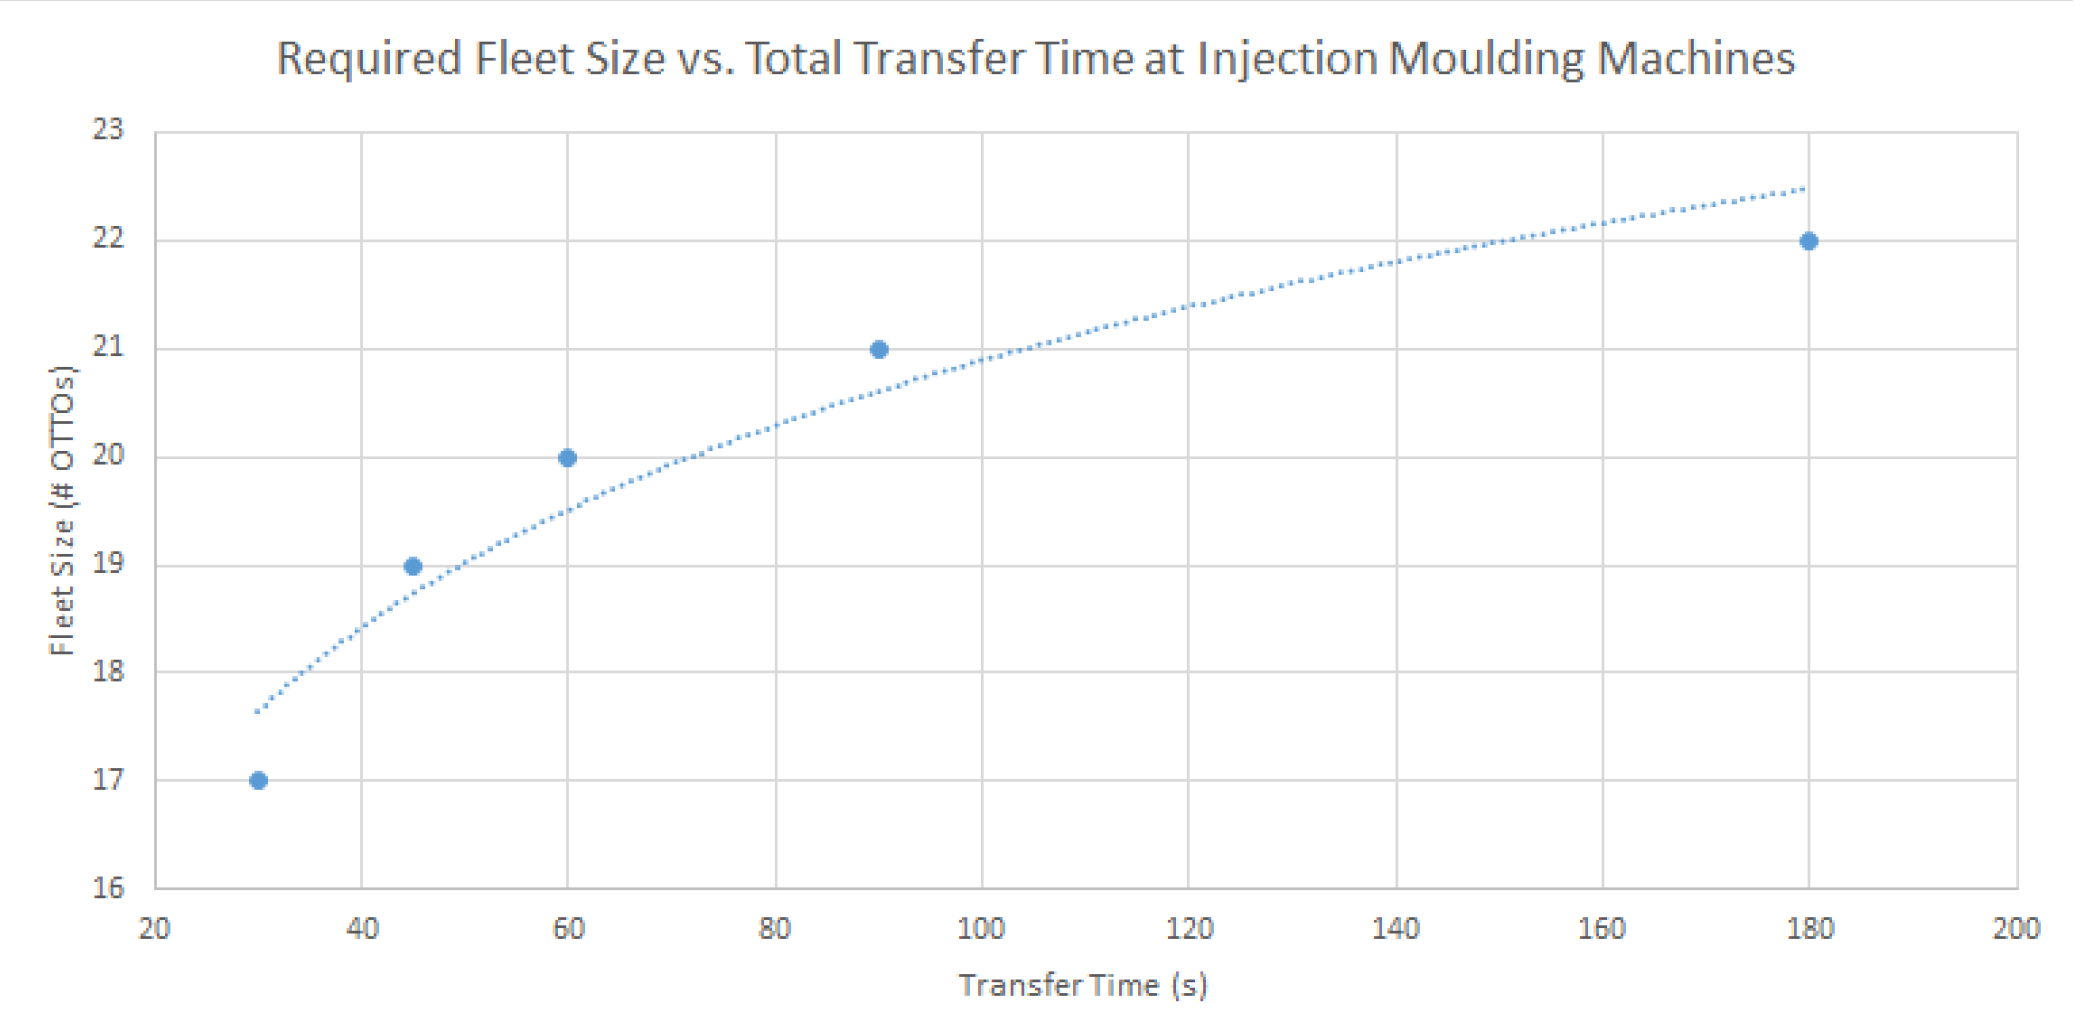
An additional value-added investigation that we provided to the client was a sensitivity analysis (above, right) to uncertain parameters such as transfer time of parts to the SDVs at the injection moulding machines. This allowed us to get a sense of how variations in transfer time would affect the number of SDVs required to maximize the system performance, thereby de-risking the deployment.